


PIP Track Record
To proceed to the PIP Track Record webpage, you MUST have read the Characteristics and Risks of Options Disclosure Document. If you have NOT read this document, click on the “No” button and you will be directed to read this document online, or you may call PTI at 800.821.4968 to request a hard copy.
PIP VS SPX
 |
||
SPX |
PIP |
|
| Cumulative since inception March 1998 | +57.46% | +53.01% |
| Year-To-Date | +15.76% | -0.60% |
| 1 Month | +0.71% | +0.30% |
| 1 Year | +15.76% | -0.60% |
| 3 Year | +34.81% | +1.21% |
| 5 Year | +5.97% | -5.53% |
| 10 Year | +89.17% | +35.69% |
PIP Performance indicates gains cumulative since inception of March 1998, YTD, 1-month, 1, 3, 5, and 10-year records ending December 31, 2012, that the PIP produced consistent returns in a hedged portfolio. Supporting documentation for the performance of the PIP program can be obtained from Dan Haugh and can be requested by calling 800.821.4968 or by email at Dan@PTISecurities.com.
Performance History
From inception of the Program in March 1998 to mid- 2000 the market had a relatively strong advance, topping out in August of 2000 with the S&P up 41% since the March 1998 start. The PIP lagged the market during this period, with a total return of 31% from March 1998 to August 2000. From that August 2000 market top the S&P sold off rather steadily and steeply to a low in July of 2002 of minus 15.8% in the S&P, meaning the S&P gave back the 41% it had been up and was down an additional 15.8%. The PIP Program lost as well, but went from a positive 31% to a positive 9%. From that low point the S&P rallied to a high of positive 58% in October of 2007, while the PIP was up 62% from March 1998 to the same point. Again, as expected, the PIP lagged the S&P at a time of an extended market advance. From that October 2007 high in the S&P, the market had a severe sell-off to the March of 2009 lows of minus 13%, while the PIP gave up only 13% to still be up 49% since March of 1998. Since that low in March 2009 the S&P has staged another dramatic rally to go from down 13% to up 23% from March 1998 to March 2010. In that same period the PIP has actually had a negative return, now up 52% since March 1998. What the graph shows is as predicted, the Program under performs in periods of rapid market advance and over performs in periods of market declines. It also shows that there can be and has been some extenuating market conditions (such as extreme movements in implied volatility) that can influence the predicted performance of the PIP vs. the S&P 500.
This track record is derived from the actual returns of the largest accounts using the S&P 500 (SPY) and reflects the return of over 30% of the assets invested in the Protected Index Program (PIP) using the SPY. Multiple accounts are included in the track record to reflect the fact that any one account may have a slightly different put or call strike (or both) on any given month due to market conditions when the accounts were invested. PIP returns are inclusive of all costs. This return represents the average return achieved by amounts invested in the S&P 500 Protected Index Program over the time frame indicated. The return is based on cash invested and uses no leverage or borrowed funds. For the first several years of the track record, accounts were advised on both a discretionary and a non-discretionary basis. Although PTI was responsible for making investment recommendations to non-discretionary accounts, they were free to accept, reject or modify those recommendations and had ultimate decision-making authority. Such decisions by the client could have impacted the performance. Currently all accounts included in this track record are managed by PTI. Returns in the composite do not include the reinvestment of dividends, interest and cash generated from covered calls writing, and if all accounts did include reinvestments, this would slightly increase the performance. The investment performance of any individual portfolio may have been better or worse over this period than the results shown herein. By presenting the composite performance, no representation is made that any particular portfolio or group of portfolios had precisely this performance. Past performance is no guarantee of future results. PIP returns are inclusive of all costs. PTI does not charge any management fees for PIP accounts, however, all trades made in this program will be charged our broker assisted commission for that trade and all of these commissions have been included in the calculation of the track record. Click for PIP commission rates.
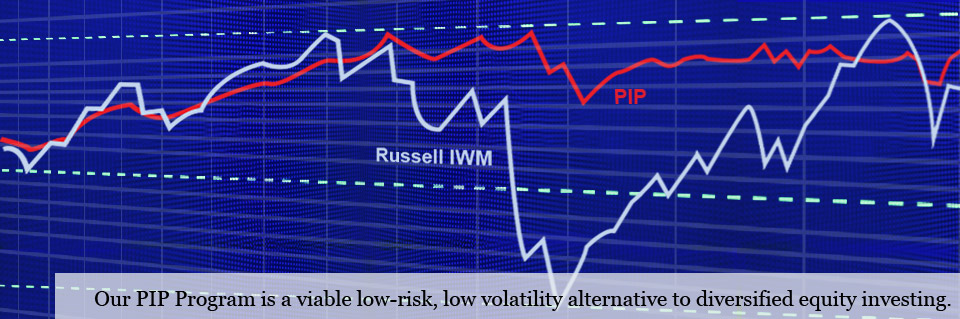
PIP VS IWM
 |
||
IWM |
PIP |
|
| Cumulative since inception July 2005 | +34.92% | +37.07% |
| Year-To-Date | +16.62% | +6.40% |
| 1 Month | +3.35% | +3.09% |
| 1 Year | +16.62% | +6.40% |
| 3 Year | +40.82% | +11.74% |
| 5 Year | +18.28% | +10.58% |
PIP Performance indicates gains cumulative since inception of July 2005, YTD, 1-month, 1, 3 and 5-year records ending December 31, 2012, that the PIP produced consistent returns in a hedged portfolio. Supporting documentation for the performance of the PIP program can be obtained from Dan Haugh and can be requested by calling 800.821.4968 or by email at Dan@PTISecurities.com.
Performance History
From the inception of the Russell Index Program (IWM) in July 2005 to August 2007 the IWM had a steady advance, with the Russell advancing 27% and the IWM PIP advancing 24%. From that date until March 2009 the Russell had a sharp sell-off, taking the IWM from a positive 27% to a negative 39% since July 2005. The IWM PIP also lost ground, but remained positive 10% at it low point in March 2009. Since that date the IWM has rallied back strongly to be only down 1% as of February of 2010, while the IWM PIP has rallied less strongly from the low of March 2009 to be up 22% at the end of February 2010. Again, the program has reformed as predicted, under performing in periods of strong market advances and over performing in periods of market declines.
This track record is derived from the actual returns of the largest accounts using the Russell 2000 (IWM) and reflects the return of over 25% of the assets invested in the Protected Index Program (PIP) using the IWM. Multiple accounts are included in the track record to reflect the fact that any one account may have a slightly different put or call strike (or both) on any given month due to market conditions when the accounts were invested. PIP returns are inclusive of all costs. This return represents the average return achieved by amounts invested in the Russell 2000 Protected Index Program over the time frame indicated. The return is based on cash invested and uses no leverage or borrowed funds. All accounts included in this track record are managed by PTI. Returns in the composite do not include the reinvestment of dividends, interest and cash generated from covered calls writing, and if all accounts did include reinvestments, this would slightly increase the performance. The investment performance of any individual portfolio may have been better or worse over this period than the results shown herein. By presenting the composite performance, no representation is made that any particular portfolio or group of portfolios had precisely this performance. Past performance is no guarantee of future results. PIP returns are inclusive of all costs. PTI does not charge any management fees for PIP accounts, however, all trades made in this program will be charged our broker assisted commission for that trade and all of these commissions have been included in the calculation of the track record. Click for PIP commission rates.